Run Line Betting in MLB: Why Every Spread Is 1.5 and How to Beat It
Table of Contents
- Why the MLB run line is locked at 1.5
- How a run line bet actually settles
- The hidden cost: how juice swings on the run line
- Run line versus moneyline: when each one wins
- The home-dog versus road-dog split that defines 2025
- What “covering” really looks like across a season
- Alternate run lines: ±2.5 and beyond
- Why the starting pitcher dominates run-line value
- Run line traps to avoid as a UK bettor
- Bringing the run line into your overall MLB process
Why the MLB run line is locked at 1.5
The first time I tried to explain the MLB run line to a friend who’d grown up on Premier League handicaps, he asked the same question every UK punter eventually asks: why isn’t there a half-point line, or a two-and-a-half line, or some moving handicap that scales with how lopsided the matchup looks? I get it. In football we expect Asian handicaps to flex. In NFL the spread can sit anywhere from -1 to -14. Baseball, stubbornly, fixes the bar at 1.5 and refuses to budge.
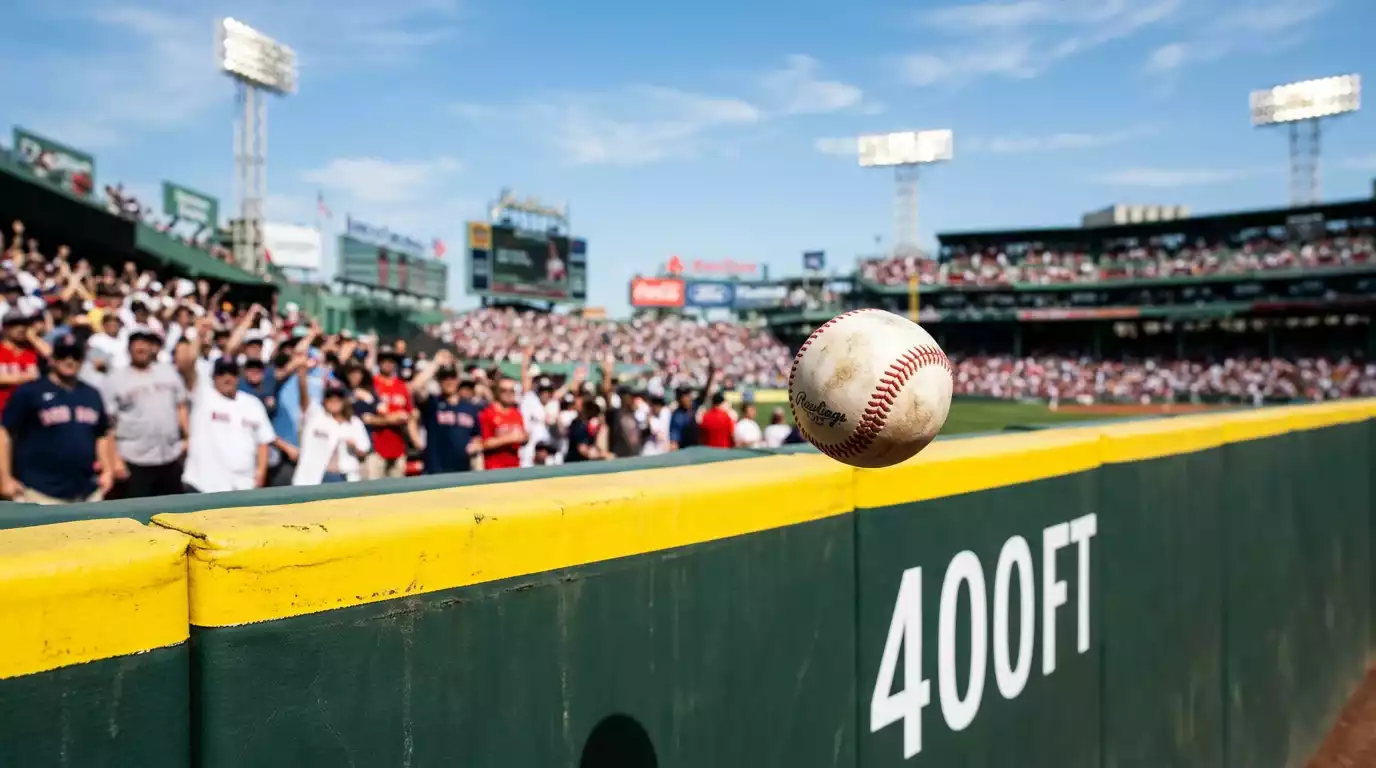
Here’s the punchline. Close to 30% of all MLB regular-season games are decided by exactly one run, and that single fact does more work than any other to explain the structure of the market. When nearly a third of your sample lands on a one-run margin, a 0.5 line collapses into a moneyline and a 2.5 line removes most of the drama from the spread. Sportsbooks settled on -1.5 / +1.5 because it splits the universe of outcomes into two roughly comparable halves while still giving each side a meaningfully different price.
That’s not a marketing decision. It’s a probability decision dressed up as a betting market. Once you internalise that one number, almost everything else about the run line — why -1.5 prices look so juicy, why +1.5 underdog tickets feel safer than they pay, why elite teams still cover under 60% of the time — flows from it. The whole rest of this guide is essentially me arguing that 1.5 is not a quirk of baseball. It’s the heart of the sport’s betting maths, and once you treat it that way, the markets start making a lot more sense.
One more thing before we get into the mechanics. I’ve been pricing MLB runlines for over a decade, and the punters who tend to do well on this market are not the ones with the strongest statistical models. They’re the ones who understand exactly what +1.5 buys them and what -1.5 forces them to give up. The maths is secondary. The framing is everything.
How a run line bet actually settles
I lost my first run line bet because I didn’t read the small print on extra innings. It was a Padres-Dodgers game, the Dodgers were -1.5, they were ahead 4-2 in the bottom of the ninth, and I went to make tea convinced I’d cashed. By the time the kettle had boiled, the Padres had tied it. The game ran into the eleventh, the Dodgers won 5-4, my -1.5 ticket was a loser by exactly the run line. Lesson learned: settlement happens at the final whistle of the actual game, not whenever the favourite happens to be ahead by two.
The basic mechanic of a run line bet is straightforward. The favourite is listed at -1.5, meaning they must win by two or more actual runs. The underdog is listed at +1.5, meaning they either win outright or lose by exactly one run. There is no draw, because MLB games go to extra innings until one side has a higher score after a complete inning. You can’t push a 1.5 line. There’s no half-run scoring. Either the margin is one run, two runs, or more.
The settlement rules that catch British punters out usually live in the rain delay zone. If a game is called before five complete innings — four-and-a-half if the home side is leading — the entire game is voided and run line bets are refunded. After that threshold, most UK bookmakers settle on the official MLB box score, which means a 6-2 game called in the seventh is a -1.5 winner. A few operators set their own threshold at 8.5 innings before treating run lines as live, which is more conservative but tougher on punters who like to take big underdogs hoping for a quick rain-out cover. I’ll come back to this in the section on traps further down.
A worked settlement example helps the rest of the article hang together. Imagine a Yankees-Red Sox game with the Yankees at -1.5 priced at +115 in American odds, or roughly 23/20 in UK fractional. I stake £20. Outcome A: Yankees win 7-3. The margin is four runs, comfortably above 1.5, and I collect £20 × 23/20 = £23 profit, returning £43 total. Outcome B: Yankees win 4-3. The margin is one run, which is below 1.5, so the -1.5 ticket loses despite the Yankees winning the game. Outcome C: Red Sox win 5-2. The Red Sox +1.5 ticket wins because the underdog either wins outright or loses by one. The same +1.5 ticket would also have won if the Red Sox had lost by exactly one, say 4-3. In MLB run lines you’re not betting on the winner. You’re betting on the margin.
The hidden cost: how juice swings on the run line
Punters new to MLB often assume the run line is a free upgrade. You take the favourite, you only need them to win by two, and the price is suddenly closer to even money instead of the brutal -180 moneyline you’d otherwise pay. What’s not to love? The thing nobody mentions in the marketing material is that the bookmaker’s margin doesn’t disappear. It just gets repackaged into the run line price.
Here’s how I think about it. A heavy favourite at -200 moneyline — 1/2 in fractional, 1.5 in decimal — implies a roughly 67% win probability before margin. Move that same team to -1.5 on the run line and they have to do something harder, win by two, and the price typically reflects that with a number around +120 or +130 — so 6/5 or 13/10 in fractional. That looks generous. But the implied probability behind that price is usually right around 45%, which is approximately how often a -200 favourite actually wins their game by more than one run.
So the run line isn’t free value. It’s the same probability question, priced differently, with the same vig embedded. The interesting part is that vig isn’t distributed evenly. On heavy favourites, the -1.5 price often carries the bigger margin, because the bookmaker is happy to let you take a longer-priced ticket on a team that nominally “should win”. On more balanced games — pick’ems and small favourites — the run line tends to be more efficiently priced, because the gap between winning the game and winning by two is smaller and easier to model.
The practical takeaway: shop the run line price the same way you’d shop a moneyline. A swing from +115 to +130 on the same favourite isn’t cosmetic. Across a 162-game season, the punter who routinely takes the inferior price gives back several percent of their expected return. UK bookmakers vary more than you’d think on MLB lines, partly because not all of them have deep liquidity on the sport and partly because some lean on US odds feeds while others use European pricing models.
Run line versus moneyline: when each one wins
The honest answer to “should I take the run line or the moneyline?” is “it depends on the matchup, the price, and what you actually believe about the game”. The unhelpful version of that answer would stop there. The useful version starts with three questions I run through every time I’m choosing between the two markets.
First question: how confident am I that the favourite wins outright? If I’m pricing a starter who I think is genuinely better, on a road trip going well, against a team in a slump — the moneyline is the cleaner expression. If the favourite wins 6-5 in eleven innings, the moneyline cashes; the -1.5 doesn’t. Long-run samples back this up. In a five-year regular-season window, MLB favourites went 7,469 to 5,530 straight up, a 57.5% rate. Underdogs came in at 41.2% straight up at average odds of +136.8. Across that whole span, MLB underdogs win approximately 44% of games, which is closer to four out of every nine than the casual “they hardly ever win” framing suggests.
Second question: do I think the favourite wins by a wider margin than the market is pricing? If I’m watching a top-tier ace face a bullpen day, and I expect a four or five-run game, the run line is dramatically better value than the moneyline. The -1.5 at +130 returns more than the moneyline at -180 for the same investment, and the probability of the favourite winning by two-plus in a starter mismatch is meaningfully higher than the run line price implies.
Third question: am I taking the underdog because I think they win, or because I just want a margin cushion? This is where +1.5 becomes either smart or lazy. Smart +1.5 looks like a road underdog facing an ace, a team you don’t trust to win outright but expect to keep close, priced at a fair number near -130 or -140. Lazy +1.5 looks like a heavy underdog at -180 on the run line, where you’ve effectively turned a 44%-chance moneyline into a 60%-chance ticket but paid back nearly all the upside.
The 2025 season produced one of the cleanest splits I’ve seen on this. Home underdogs posted a 45.9% win rate, while road underdogs sat at 33.1%. That’s a colossal gap. It tells you that home-field for an underdog is doing a lot of price-correction work that the market doesn’t always fully account for. If you’re going to play +1.5 underdog tickets, the home dog is the spot where the cover rate stretches comfortably above what most run line prices imply.
The home-dog versus road-dog split that defines 2025
I keep a notebook of bets I should have made and didn’t. Last season half of it was filled with home underdogs I talked myself out of. The 12.8 percentage point gap between home and road dog win rates in 2025 isn’t a small inefficiency — it’s a structural feature of the season that deserves its own betting strategy.
What’s actually driving it? A few things. Home teams in MLB have always carried a small but real edge — last licks in the bottom of the ninth, familiarity with park dimensions, no travel that day. For an underdog those small edges matter disproportionately, because the underdog needs every percentage point they can get just to lift their win probability into the 40s. A home underdog at +130 fractional with a 46% win rate is one of the most reliably profitable plays in the sport. The same team on the road, priced the same way? That’s a -EV bet, and if you back enough of them you’ll bleed your bankroll dry.
The run line angle here gets even more interesting. A home underdog +1.5 doesn’t just need the team to win — they survive a one-run loss, which on home turf is incredibly common. They get the last at-bat. They might lose 3-2 in regulation, but the bottom of the ninth gives them a chance to either win outright or lose by exactly one, both of which cash the +1.5 ticket. Practical translation: home dogs are good moneyline plays in 2025; home dog +1.5 tickets are price-dependent but often disappointing because the bookmaker has already moved most of the value into the moneyline.
The road-dog story is the inverse. A 33.1% road-dog win rate at average prices closer to +150 is comfortably below break-even. The road dog +1.5 is therefore the more attractive sleeve in this segment, because you’re buying a margin cushion in exactly the spot where the underlying win rate is weakest. The cushion gets you to about 48-50% cover rate, which combined with the typical +1.5 price of around -135 is roughly a break-even proposition before vig.
There’s a sharper way to use this split. Don’t look at favourites versus underdogs. Look at home versus road as the primary axis, then layer the price decision (moneyline versus run line) on top. Home favourites at -1.5 in pitcher-friendly matchups are one of my favourite sleeves. Road favourites at -1.5 are what I avoid almost reflexively, because the road team has fewer at-bats if they’re leading late, and a road favourite winning by exactly one run is one of the most common outcomes in baseball.
What “covering” really looks like across a season
Here’s a stat that should sober up anyone who thinks they’ve found a “system” for backing one team’s run line all year. In the 2024 MLB regular season, the team with the strongest run-line cover rate finished at 55.6%. That’s the best in the league. Even the most run-line-friendly squad in baseball failed to cover four out of every nine games.
That number changed how I size my run line bets. If the absolute ceiling for a season-long run-line angle is 55.6%, and we know flat staking against -110 needs 52.38% just to break even, the practical edge available on any single team’s run line for a full season is razor-thin. Even when you’ve identified the best-covering team, you’re operating on a 3% margin against the break-even rate, and that’s before factoring in juice that’s typically less generous than -110 on baseball runlines.
What this implies in practice: stop thinking about run line covers as a season-long property of teams and start thinking about them as a property of specific matchups. The matchup-level edges are larger and more durable. A pitcher who induces lots of weak contact, against a team that scores in clusters or not at all, in a pitcher-friendly park, with a fresh bullpen behind him — that’s a -1.5 spot where the cover rate can easily be 60% or higher despite the team’s seasonal cover rate being 51%. Conversely, a great team starting a fifth starter against a top-of-rotation arm in a hitter park — that’s a -1.5 trap regardless of the team’s overall record.
I look at three inputs to estimate run-line cover probability. The starter’s expected innings load — more innings from the favourite’s ace means more separation between the bullpens, which means more late-game scoring potential. The opponent’s bullpen rest state — a tired bullpen blows late leads, helping +1.5 tickets cash. And the park’s run environment — high-scoring parks produce wider margins on average, which favour -1.5 favourites. None of these inputs is in any way exotic. They’re all available before first pitch on public stats sites. The edge is in actually checking them.
Alternate run lines: ±2.5 and beyond
Most UK bookmakers will let you move the run line off 1.5, even if they don’t always advertise it on the main coupon. The alternate runlines — typically ±2.5 and sometimes ±3.5 for heavy mismatches — are a tool I underuse, and I think most punters underuse them too.
The simple version: -2.5 takes a favourite and demands they win by three or more, in exchange for a price closer to plus money even on heavy moneyline favourites. +2.5 buys an extra cushion on the underdog, in exchange for a tighter price than +1.5. The mechanics are identical to standard run lines; only the threshold and the price change.
Where alternate runlines actually pay is in mismatches. When you’ve got an ace going against a fifth starter, in a normal-scoring park, and you genuinely believe the game will be a blowout, -2.5 at +180 can be substantially better value than -1.5 at +120. The market often under-prices true blowout probability because blowouts are emotionally easier to take on the moneyline — where the favourite still wins regardless of margin — so the alternate runline price retains margin for the bookmaker that doesn’t fully reflect the matchup distribution.
I’d add one cautionary note. UK liquidity on alternate MLB lines is thin compared to the standard runline. Lines move slowly, max stakes are lower, and you’ll sometimes see two operators showing markedly different prices on the same alternate, which usually signals one of them is using a stale model. Treat that as opportunity, not as confusion: shop hard, and don’t be afraid to use the books that price these markets aggressively.
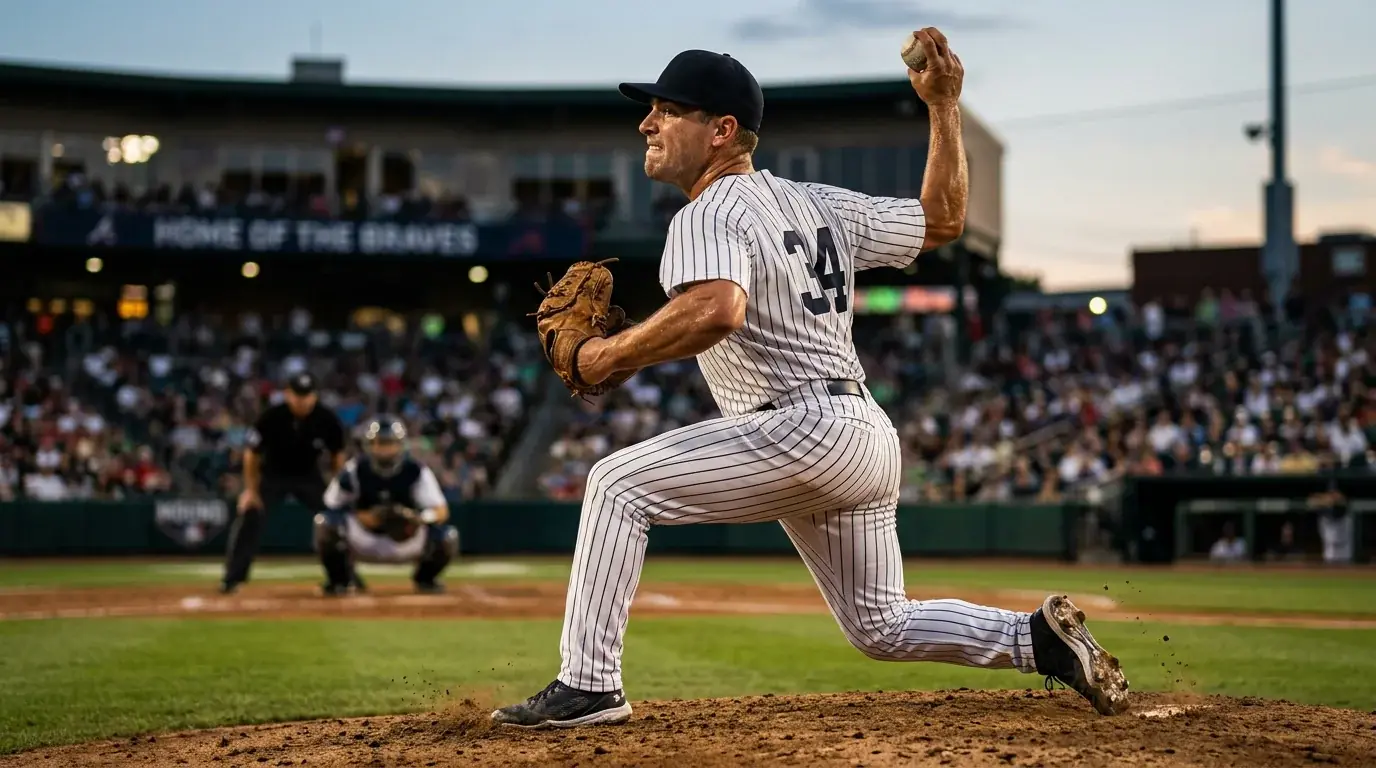
Why the starting pitcher dominates run-line value
Doug Kezirian, who’s covered baseball betting at ESPN for years, put it more bluntly than I would: “My personal preference is to isolate a particular angle and then to find a bet that reflects my analysis as closely as possible. If you think a pitcher is shaky, then bet against him in the first five innings, rather than the game line. Don’t let a bullpen ruin it.” That logic applies in reverse to run lines as well. If you think a starter is dominant, the run line is often a sharper expression of that view than the moneyline, because dominant starters produce wider margins.
The starter is, by a comfortable distance, the single biggest variable in run-line outcomes. A great starter who goes seven innings on 95 pitches gives you a one-run game that grows into a three-run margin in the bullpen handoff. A struggling starter who exits in the fourth inning down 2-0 gives you a 5-1 hole that the bullpen extends into a 7-2 finish. Either way, the run line cashes — but only if you’ve correctly identified which side the dominance falls on.
The mistake I see most often is punters reading starter quality off ERA, which is a noisy and mostly trailing indicator. ERA tells you what a pitcher’s results were. It doesn’t strip out defensive luck, sequencing luck, or the effect of facing weak versus strong lineups. For run-line decisions I lean far harder on FIP — fielding-independent pitching, which essentially asks “what would this pitcher’s ERA be if his defence was league-average and the sequencing of hits was random?”. A starter with an ERA of 3.50 and a FIP of 4.50 is probably about to get worse. A starter with an ERA of 4.50 and a FIP of 3.50 is probably about to get better. Both situations create run-line value — in opposite directions. If you want to dig further into how to read pitcher matchups, I’ve put together a more detailed guide on how to read an MLB starting pitcher matchup covering the metrics that move run-line prices.
The other under-priced lever is the bullpen behind each starter. Two teams with the same starter quality but very different bullpen depths produce wildly different late-game distributions. The team with the deeper pen will lock down narrow leads — helping their -1.5 — and steal narrow comebacks, preventing blowouts that would lose +1.5 on the other side. I check bullpen workload from the previous three days before any run-line bet involving a one-run favourite. If the favourite’s pen has been chewed up, I’m passing on -1.5 regardless of how good the matchup looks on paper.
Run line traps to avoid as a UK bettor
I’ll skip the platitudes about discipline and patience and stick to the mistakes I’ve watched cost real money on real run-line tickets, mostly mine.
The first trap is the assumption that a heavy moneyline favourite is automatically a good -1.5 ticket. They’re not. Heavy favourites in MLB at -200 or worse win roughly two-thirds of the time, but they win by exactly one run frequently enough that the -1.5 cover rate sits well below their straight-up win rate. The 57.5% straight-up favourite rate from a long-run sample drops to roughly 40-42% on -1.5 covers. If you’re paying +120 on -1.5 expecting an easy cash because the team “should win”, you’re often paying for a 41% probability with a 45% implied price.
The second trap is assuming +1.5 underdogs are “safe”. They’re not safe; they’re just less catastrophic. The price you pay for +1.5 typically chops nearly all of the moneyline upside out of the bet. A +180 underdog at +1.5 -135 has roughly the same break-even win rate as the moneyline (around 57.5% to 58%), but the upside on a winning ticket is much smaller. If you genuinely think the underdog wins, take the moneyline. If you think they’ll keep it close but probably lose, take +1.5. Don’t conflate the two reasons.
The third trap, and the one I see UK punters fall into most, is shopping run lines by team rather than by matchup. Backing the same team’s run line every game because they’re “the best run-line team in the league” is a structural mistake. The 55.6% league-leading cover rate from 2024 is the ceiling of seasonal team-level edge. Matchup-level edges blow that away. Sort by who’s on the mound, what the bullpens look like, what the park is doing. The team logo is the least informative piece of information on the slate.
The fourth trap is settlement misunderstanding around rain. Some books treat games as official after five innings. Others wait for 8.5. Some refund -1.5 if a game is called when the favourite is leading by exactly one — the official MLB result is a one-run win, so the -1.5 loses. Others refund all bets. This isn’t a rounding error. Over a season, the difference between operators can swing several units in either direction. Read your bookmaker’s MLB rules page once at the start of the season and you’ll save yourself the surprise I had with that Padres-Dodgers extra-innings nightmare years ago.
The fifth and last trap is overusing the alternate runline. ±2.5 looks juicy because the price is bigger, but you’re buying further into the tail of the distribution where models get less reliable and bookmakers know it. Use alternates as targeted plays in genuine mismatches, not as default upgrades because the headline price is more attractive.
Bringing the run line into your overall MLB process
If you’ve read this far, the takeaway shouldn’t be “the run line is great, bet it more”. It should be more nuanced than that. The run line is a tool. Sometimes it’s the right expression of a view; sometimes the moneyline is. The fact that 30% of MLB games are decided by exactly one run means the line’s structure punishes heavy moneyline favourites in tight games and rewards underdogs more often than the casual fan would guess. Once that one stat lives rent-free in your head, the rest follows.
Two final habits worth adopting. Track every run-line bet against the moneyline price at the time you placed it, so you can see, after a few months, whether your run-line picks are systematically better or worse than the equivalent moneyline play. That comparison is the cleanest signal of whether you’re actually adding value with run-line bets or just paying extra juice for the comfort of a margin cushion.
And second, when you’re undecided between -1.5 and the moneyline, always ask the same question: do I think this is a tight game I trust the favourite to grind out, or a blowout I think the favourite is about to deliver? Tight games are moneyline territory. Blowouts are run-line territory. The pricing usually rewards correctly identifying which kind of game you’re walking into more than it rewards being right about the team itself.
Why is the MLB run line always set at 1.5 runs?
Because nearly 30% of MLB games are decided by exactly one run, a 0.5 line would collapse into a moneyline and a 2.5 line would remove most of the suspense from the spread. The 1.5 threshold splits the universe of outcomes into two roughly comparable halves while still giving each side a meaningfully different price.
What happens to a -1.5 run line if my favourite wins by exactly one run?
The bet loses. Even though the favourite won the game, they did not cover the 1.5 spread. The -1.5 ticket needs a margin of two or more actual runs at the final whistle, including any extra-innings outcome.
Is taking +1.5 on a heavy underdog a long-term winning strategy?
Not in the form most punters use it. The +1.5 price on heavy underdogs typically chops nearly all of the moneyline upside out of the bet while delivering a similar break-even win rate. The home underdog +1.5 in selected matchups can be profitable, but blanket +1.5 betting on big dogs is generally a slow bleed.
Can I move the MLB run line to plus or minus 2.5 with most UK bookmakers?
Most UK operators offer alternate run lines including 2.5 and sometimes 3.5, although liquidity is thinner and lines move more slowly than on the standard 1.5. They are most useful in true blowout mismatches where the alternate price retains margin that does not reflect the actual matchup distribution.
Created by the ”how do you bet Baseball” editorial team.