
MLB Postseason Betting: Why October Plays By Different Rules
 Available in US
Table of Contents
- The October that taught me regular-season models break
- Pitching usage: the most important shift
- Roster composition and pitching depth
- Series structure: how short series distort prices
- Weather and venue effects in October
- Umpires and strike zones in the playoffs
- Public money and the sentiment angle
- The wider question of how postseason fits into the betting calendar
The October that taught me regular-season models break
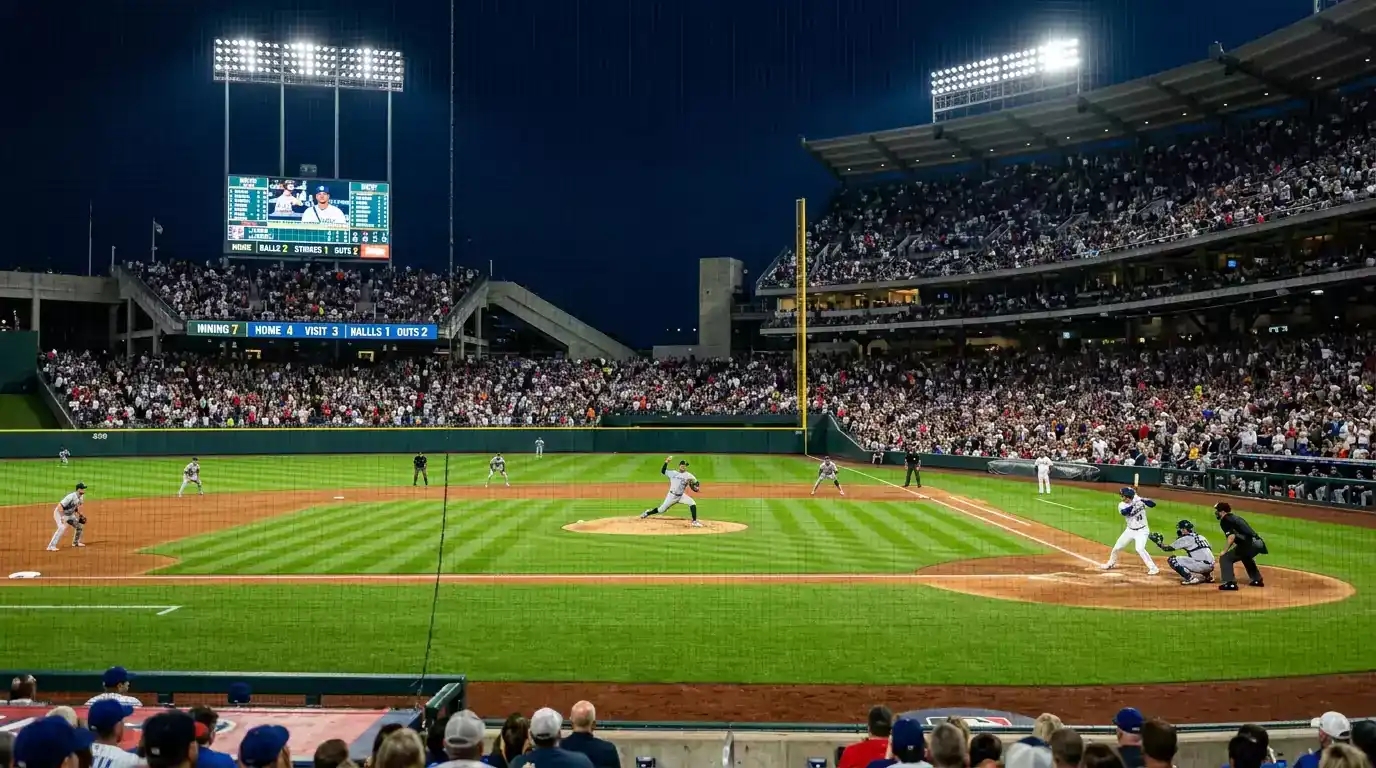
I had a great regular-season bankroll year and went into the playoffs with my models intact and my confidence high. By the end of the second round I was down 30%, every system I trusted was failing, and I couldn’t figure out what had changed. The starters were the same. The lineups were the same. The matchups looked normal. Then I went back through the bets and noticed I was systematically losing on totals – every game was scoring less than expected. The teams were still good. The conditions were still familiar. October was just structurally different to a typical July evening.
That lesson took years to fully internalise. Postseason MLB is not regular-season MLB. The pitching usage is different, the lineups are different, the umpires are different, the weather is different, and the strategic context for every decision is different. Models built on regular-season data systematically overpredict postseason scoring and underpredict the favourite’s win probability in short series. Knowing what to adjust is the difference between a profitable October and a forgettable one.
Pitching usage: the most important shift
The single biggest difference between regular-season and postseason MLB is how starting pitchers are deployed. Regular-season starters work on five days of rest, throw 95 to 105 pitches per outing, and pitch every fifth day. Postseason starters work on whatever schedule the manager needs, throw whatever pitch count the situation demands, and are often pulled aggressively the moment they show fatigue.
The implication for totals: postseason starters often go shorter than their regular-season averages. The third-time-through-the-order penalty is amplified in playoff games – managers know one bad inning can lose a series, so they pull starters earlier and more aggressively. Bullpens are stretched harder, with high-leverage relievers used in earlier innings than they would be in July.
The result is that postseason games typically feature more relievers per game than regular-season games. The relievers used are typically the team’s best, brought in more aggressively. The aggregate run output is suppressed because the late-game pitching is structurally better than in a normal regular-season game.
Postseason totals run consistently below regular-season totals between the same matchups. Bookmakers know this and price it in, but the line for individual postseason games sometimes lags the actual structural shift, especially early in October when the market is still recalibrating.
Roster composition and pitching depth
Postseason rosters are tilted heavily toward pitching depth. Teams typically carry twelve or thirteen pitchers on a postseason roster compared to twelve to fourteen in the regular season, but the composition is different – more high-leverage relievers, fewer mop-up arms. Long-relief pitchers who eat innings in lopsided regular-season games rarely make postseason rosters.
The implication: any postseason game has a structurally tighter range of pitching outcomes than its regular-season equivalent. Garbage-time innings against a fifth-best reliever don’t happen – the leverage relievers come in even when the score is decided, because keeping the lower-quality arms on the roster wasn’t a priority.
The other roster shift is on the position-player side. Bench composition changes for postseason play – more right-handed pinch hitters available against left-handed setup men, more defensive replacements available for late innings, and fewer one-dimensional players who don’t fit the high-leverage matchup template. The lineups posted in October are usually deeper than the lineups in July, with fewer obvious matchup mismatches.
The MLB attendance data underscores how seriously teams and fans treat October. Regular-season attendance reached 71,409,421 in 2025, the third consecutive season above 70 million for the first time since 2015 to 2017. The intensity of October baseball is structurally elevated relative to a normal regular-season night, and the on-field play reflects that.
Series structure: how short series distort prices
The postseason is a sequence of best-of-three, best-of-five and best-of-seven series. Each series structure has its own pricing dynamics that differ from how the regular season is priced.
Best-of-three series are extremely volatile. The favourite’s series probability is much closer to coin-flip than the regular-season head-to-head record would suggest, because three games is a small sample where random variance can dominate skill. Bookmaker series prices tend to overweight the regular-season favourite slightly, which means the underdog often offers structural value in best-of-three series moneylines.
Best-of-five and best-of-seven series are more stable. The favourite’s series probability is closer to what the regular-season indicators would suggest, but still slightly compressed because the higher-quality starters get more outings in longer series, partially offsetting roster-depth advantages.
The game-by-game lines within a series have their own dynamics. Game one of a series, with both teams having their best starter available, is typically the highest-quality matchup. Games four and five (in a best-of-five) or games six and seven (in a best-of-seven) feature elimination pressure and often see starters working on short rest, which structurally shifts the line.
The strategic implication: don’t assume regular-season head-to-head pricing transfers directly to series pricing. Each game in a series has unique context, and the series-as-a-whole has its own pricing dynamics separate from the sum of the individual game probabilities.
Weather and venue effects in October
October baseball is colder than regular-season baseball almost everywhere except the warm-weather venues in Texas, California and Florida. Cold air is denser, fly balls don’t carry as far, and run scoring is suppressed. The temperature relationship with run scoring – around 4.2 runs per game in temperatures below 60°F compared to more than 4.7 runs per game at 80°F and above – is most relevant in October when game-time temperatures often sit in the 50s or below.
The implication for totals: October games at northern venues consistently underperform their regular-season equivalents by a measurable margin. Bookmakers price this in, but not always fully – the line for a Toronto game in late October is typically lower than a Toronto game in July, but not always lower by enough.
The other venue effect is the wind shift in October. Many MLB stadiums have prevailing wind patterns that change between summer and autumn. A park that played as a hitter park in July might play as a pitcher park in October because the autumn wind blows in rather than out. Always check the day-of forecast for postseason games rather than relying on summer-based assumptions.
The schedule means most postseason games are played at night, with first pitch typically in evening hours. Evening temperature drops can be significant in October at northern parks. A 4pm forecast of 65°F can mean a 9pm reality of 50°F, with a corresponding shift in fly-ball physics that the line might not fully capture.
Umpires and strike zones in the playoffs
Postseason umpiring is a small but real factor in playoff betting. The umpires assigned to the playoffs are typically the most experienced and most aggressive crews in the league. Strike zones tend to be slightly tighter than regular-season strike zones, which means more walks and more deep counts, which means slightly higher pitch counts and slightly earlier exits for starters.
The effect is small but compounds across a series. A starter facing a tighter strike zone might labour through five innings at 95 pitches rather than navigating six on the same pitch count. The bullpen exposure is therefore higher, and the run-scoring volatility increases accordingly.
The other umpire effect is on review and challenge dynamics. Postseason games feature more reviews, more strategic timeouts, and more mound visits than regular-season games. The pace context here matters – average MLB game time has settled at 2 hours 38 minutes during the regular season, but postseason games typically run 25 to 35 minutes longer than the regular-season average for the same matchup. The pace difference doesn’t directly affect betting math, but it does affect the rhythm of the game and the cumulative bullpen exposure across a series.
Public money and the sentiment angle
Postseason MLB attracts dramatically more recreational money than the regular season. Casual bettors who don’t engage with regular-season MLB suddenly have opinions about playoff series, and those opinions often track media narratives rather than analytical reads.
The result is that public money in October flows toward the team with the better story – the underdog with a Cinderella narrative, the favourite with the superstar player, the team with home-field advantage. Bookmaker lines move accordingly, and the contrarian position often offers structural value.
The angle isn’t simply “fade the public.” That’s too crude. The angle is to identify the spots where public sentiment has moved the line meaningfully off where the analytical read suggests it should be, and to take the position the public is collectively avoiding. In October that’s most often the underrated favourite (when the underdog has a media narrative) or the underrated underdog (when the favourite is widely expected to dominate).
Game-time pricing in postseason games shifts more than in regular-season games as recreational money piles in through the day. Getting in early on the right side often captures meaningful CLV that disappears by first pitch.
The wider question of how postseason fits into the betting calendar
Postseason MLB is high-volatility, high-volume, and high-emotion. The discipline that’s required during the regular season is required at multiples in October. Bet sizing should be tighter, not larger, despite the temptation to chase the bigger handle. Bankroll management matters more, not less, in the postseason.
The skills that produced a profitable regular season are the same skills that produce a profitable postseason. The framework adjusts: pitching usage is different, totals trend lower, series prices behave differently than head-to-head reads suggest. But the underlying analytical workflow – reading the matchup, checking the conditions, evaluating the line – is the same.
The starters in particular deserve careful re-handicapping in October. Postseason starters are pitching shorter, with deeper bullpens behind them, in colder weather, against tighter strike zones. The framework on how to handicap an MLB starter from the ground up applies fully – just remember that every input has an October-specific context that shifts the read.
Why do postseason games typically score less than regular-season equivalents?
Three structural reasons. First, postseason starters are pulled earlier than regular-season starters because managers know one bad inning can lose a series. Second, postseason bullpens carry only the team’s best relievers – no mop-up arms – so late-inning pitching is structurally better. Third, October weather at most northern venues is colder than the regular season, and cold air suppresses fly-ball carry and run scoring. The combined effect typically reduces actual runs by 0.4 to 0.7 below what the same matchup would produce in July.
Is the underdog moneyline a structural value in best-of-three series?
Often, yes. Best-of-three series are short enough that random variance can dominate skill, which means the favourite’s series probability is closer to a coin flip than head-to-head records would suggest. Bookmakers tend to overweight the regular-season favourite in series pricing, leaving the underdog with positive expected value at modest odds. The angle is most reliable when the underdog has at least one elite starter available for the short series – a single dominant starter can produce a meaningful series win probability bump in three games that’s larger over five or seven.
Prepared by the how do you bet Baseball editorial staff.